


.png)
DPMO stands for Defects Per Million Opportunities. It measures how many defects occur per million chances for a defect to occur, where an "opportunity" is any characteristic of a product or process that could fail to meet a quality specification.
DPMO is the standard quality metric in Six Sigma methodology. It allows operations teams to compare quality performance across processes of very different complexity: a process with 50 possible failure points per unit and a process with 5 possible failure points per unit cannot be compared on raw defect counts. DPMO normalizes for complexity, making comparison valid.
DPMO = (Number of Defects / (Number of Units × Opportunities Per Unit)) × 1,000,000
Where:
The multiplication by 1,000,000 scales the result to a rate per million, which makes small defect rates easier to compare and communicate.
A circuit board assembly operation inspects 500 boards during a production run. Each board has 24 solder joints, and each joint is an opportunity for a solder defect. During inspection, quality technicians log 36 defects total across all 500 boards.
Step 1: Identify the inputs
Step 2: Calculate total opportunities
Step 3: Calculate DPMO
This circuit board assembly process has 3,000 defects per million solder joint opportunities. Using the Sigma level conversion table below, 3,000 DPMO falls just above 4 Sigma.
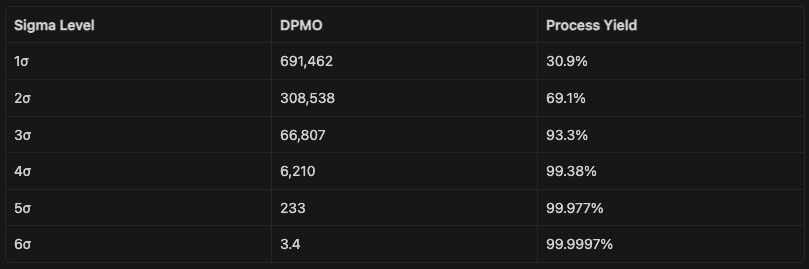
The worked example above (3,000 DPMO) falls between 4 Sigma and 5 Sigma, closer to 4 Sigma.
Six Sigma (3.4 DPMO) is the target in high-reliability industries: semiconductor manufacturing, aerospace, medical devices. Most general manufacturing operations run between 3 Sigma and 4 Sigma. A new quality improvement program starting from baseline data often first aims to reach 4 Sigma (6,210 DPMO), which represents a significant improvement from the 3 Sigma typical starting point.
The most variable and subjective part of DPMO calculation is defining what counts as an "opportunity."
Opportunities must be:
Common approaches by industry:
For electronics assembly: each solder joint, each component placement, each inspection characteristic on the drawingFor machined parts: each dimensional characteristic with a tolerance on the printFor food manufacturing: each sensory attribute (color, texture, taste), each packaging seal, each label elementFor software: each unit test assertion, each functional requirement
What changes when you change the definition: If a board initially has 24 opportunities defined and you later add 6 more, your historical DPMO and current DPMO are no longer comparable. Document the definition, version it, and apply it consistently.
These three quality metrics are often used interchangeably. They measure different things.
PPM (Parts Per Million defective): Measures defective units, not individual defects. One unit with three defects counts as 1 PPM. PPM = (Defective Units / Total Units) × 1,000,000.
First Pass Yield (FPY): The percentage of units that pass all quality requirements on the first attempt, without rework. FPY = (Good Units / Total Units) × 100. FPY does not account for process complexity.
DPMO: Counts individual defects (not defective units) and normalizes for the number of opportunities per unit. One unit with three defects counts as three toward the DPMO numerator.
Use PPM when the key question is what proportion of units shipped to customers are defective. PPM is customer-facing: it directly predicts field returns and warranty claims.
Use FPY when evaluating a specific process step's output quality, particularly in multi-step processes where rolled throughput yield matters. See Manufacturing KPIs: The Metrics Operations Teams Actually Track for how FPY fits alongside other quality metrics.
Use DPMO when comparing quality performance across processes of different complexity, benchmarking against Six Sigma standards, or tracking improvement over time in a formal Six Sigma program.
A process can have low DPMO (few defects per opportunity) and low FPY (many defective units) if each unit has a large number of opportunities and most units have at least one defect. DPMO and FPY tell you different things about the same process.
OEE's Quality component is calculated as: Good Units / Total Units Produced (first pass, no rework).
DPMO and OEE Quality are related but not equivalent:
An OEE Quality score of 94% corresponds to an FPY of 94%: 6% of units have at least one defect. DPMO on the same process depends on how many opportunities per unit are defined. If each unit has 10 opportunities and 6% of units fail, DPMO may be much lower than 6% of 1,000,000 because some defective units fail only one of their 10 opportunities.
For manufacturing environments using both metrics, OEE Quality tracks machine-level first-pass performance while DPMO tracks the rate of individual defect occurrences for Six Sigma benchmarking. See OEE Formula: How to Calculate Overall Equipment Effectiveness.
Counting defective units instead of defects. The numerator in DPMO is individual defect occurrences, not the count of defective units. One unit with three defects is three defects in the numerator, not one.
Changing the opportunities-per-unit definition mid-program. Any change to the definition invalidates historical comparisons. If you add inspection points, rebaseline DPMO and note the date of the definition change in your data.
Using different definitions across product lines. If product A has 10 defined opportunities and product B has 25, DPMO figures are not directly comparable across them. Either standardize definitions or interpret comparisons with caution.
Treating DPMO as equivalent to PPM. DPMO will almost always be lower than PPM on the same process because DPMO denominator is inflated by the number of opportunities per unit. A process with 10 opportunities per unit and 5% defective units has a PPM of 50,000 but a DPMO of 5,000.
Manual DPMO tracking requires inspectors to log the number of defects found during each inspection event. In most facilities, this means paper forms completed at the end of an inspection run, then entered into a spreadsheet later. By the time DPMO is calculated, the data is hours or days old.
n8n-based approach to real-time DPMO tracking:
Replace the paper defect log with an n8n Form node deployed as a simple inspection entry form:
Each submission writes to a Google Sheets log row via the Google Sheets node. A second sheet performs the DPMO calculation automatically:
An n8n workflow checking this sheet on a schedule can send an alert when DPMO for the current shift or batch crosses a control limit. If DPMO exceeds 10,000 before shift end, the quality manager gets a notification while the run is still in progress.
For the Google Sheets automation that feeds this approach, see How to Automate Google Sheets with n8n (No Code).
For connecting DPMO to a live operations dashboard alongside OEE and other quality metrics, see How to Build a Manufacturing Operations Dashboard with Retool.
DPMO stands for Defects Per Million Opportunities. It is a quality metric from Six Sigma methodology that measures the rate of individual defects relative to the total number of opportunities for a defect to occur.
Six Sigma quality is 3.4 DPMO. Most general manufacturing operations run between 3 Sigma (66,807 DPMO) and 4 Sigma (6,210 DPMO). A realistic improvement target for a new quality program is to reach 4 Sigma, which represents 99.38% defect-free opportunities.
PPM counts defective units per million units produced. DPMO counts individual defects per million opportunities for a defect to occur. One unit with three defects counts as 3 in DPMO but 1 in PPM. DPMO also normalizes for process complexity by dividing by opportunities per unit. PPM does not.
Opportunities are the characteristics of each unit that could fail to meet a quality specification. For a machined part, each tolerance dimension on the drawing is one opportunity. For a circuit board, each solder joint is one opportunity. The definition must be established before data collection, documented formally, and held constant across measurement periods for comparisons to be valid.
The Flow Kaizen guide covers how to structure quality data collection workflows and connect defect tracking to a live operations dashboard, including how to sequence quality automation alongside production and inventory workflows.

.png)
