

.png)
Most manufacturers already do root cause analysis. They just don't call it that, and they usually stop one step too early.
A machine jams. An operator clears it and restarts the line. It jams again two hours later. The operator clears it again. By the end of the week it has jammed six times, cost roughly ninety minutes of downtime, and nobody has written anything down, because each individual jam felt too small to investigate.
Root cause analysis (RCA) is the structured version of the question every good operator already asks after the third time something breaks: why does this keep happening, and what would actually stop it. The difference between doing this informally and doing it as a documented process is that the documented version produces a corrective action that survives after the person who noticed the problem moves on to something else.
This post covers the 5-step RCA process, a template you can copy directly into a spreadsheet or shared doc, the two most common analysis tools (5 Whys and the fishbone diagram) with worked manufacturing examples, and how to automate the parts of the process that usually fall apart: tracking who owns the corrective action and whether it actually got verified.
A symptom is what you observed. A root cause is the condition that, if removed, would prevent the symptom from recurring.
Symptom: The conveyor jams at the transfer point.First-level cause: Product is arriving misaligned at the transfer point.
Root cause: A guide rail bracket has worked loose over the last several weeks of vibration, letting the rail drift out of tolerance.
If you stop at "product is arriving misaligned" and just have operators nudge product by hand, the jam comes back, because the loose bracket is still loose. RCA exists to keep asking past the first plausible-sounding explanation until you reach something you can actually fix once.
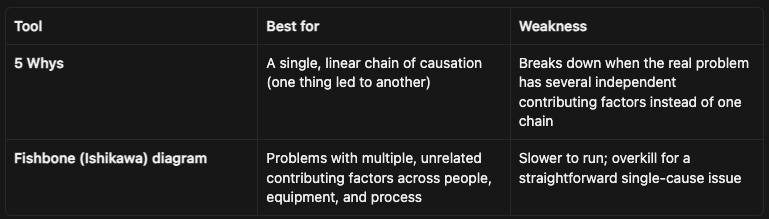
Both tools organize the same 5-step process. Which one fits depends on how many contributing factors are likely in play.
Problem: Conveyor 3 jams at the transfer point to packaging.
Root cause: an outdated fastener spec, not the operator, not the product, not "the machine is old." The corrective action is a spec change and a check of every other fixture using the same part, not a one-time bracket tightening.
Use a fishbone when the problem doesn't resolve into one clean chain. Standard manufacturing categories (the "6M"): Man, Machine, Method, Material, Measurement, Environment.
Problem: A batch of parts fails a dimensional check.
Mapped this way, the team can see that tool wear (Machine) combined with a setup checklist gap (Method) is the more likely combination than blaming the new operator (Man) in isolation. A single-chain 5 Whys would have more easily gotten stuck following just one branch.
When to escalate further: For customer-facing quality issues, especially in regulated or automotive-adjacent supply chains, a fishbone or 5 Whys often feeds into a more formal 8-discipline (8D) corrective action report, which adds containment actions and supplier notification steps on top of the same root cause work. That's a heavier process reserved for issues that leave the plant, not for internal line stoppages.
Copy this structure into a shared spreadsheet or form so every investigation produces the same fields, regardless of who runs it.
Header fields
Problem statement
Investigation
Corrective action
Verification
The fields that get skipped most often in practice are "how the root cause was verified" and the entire verification section. Both exist specifically to stop RCA from becoming a documentation exercise that doesn't change anything.
Not in the analysis itself. In what happens after.
A completed RCA form sitting in a folder, or a corrective action assigned in a conversation that nobody wrote down, produces the same outcome as never running the analysis: the same failure recurs in three months because nobody followed up.
The two failure points are consistent:
This is a workflow problem, not an analysis problem, and it's where automation is worth more than a better RCA template.
An n8n workflow can turn the RCA template above from a static form into a tracked process:
None of this requires new manufacturing execution software. It's a workflow layered on top of whatever you already use to log defects and downtime, whether that's a spreadsheet, a quality management system, or your ERP's non-conformance module. See How to Connect Your ERP to n8n Without a Native Connector if your defect data already lives in an ERP and you want the corrective action workflow pulling from it directly.
For the broader pattern of connecting inspection data to an automatic response instead of a manual one, see Quality Control Automation on the Shop Floor. And for how RCA findings should feed into the metrics you're already tracking, see Manufacturing KPIs: The Metrics Operations Teams Actually Track and DPMO Formula: How to Calculate Defects Per Million Opportunities.
The Flow Kaizen guide covers how to build workflows like the corrective action tracker above without custom development work, using the same automation approach used for OEE and downtime data.

.png)
