
.png)
Safety stock is the inventory you hold beyond your expected demand to protect against two things: demand that comes in higher than forecast and supplier lead times that run longer than expected.
Most operations teams have a safety stock number. The problem is where that number came from. For many manufacturers, it was set during ERP implementation based on a rough estimate. Others carried it over from a spreadsheet built years ago, when lead times and demand patterns looked different than they do today.
This post walks through the safety stock formulas, when to use each, and how to calculate the right buffer for your actual operation.
The instinct is to hold safety stock equal to average daily demand times average lead time. The problem: your operation does not run on averages.
A stockout does not happen on the average day. It happens on the day demand spikes, or the day a supplier runs two weeks late instead of one. Safety stock is specifically designed to cover those non-average situations.
If your safety stock is calculated using only average figures, you are not holding a buffer against variability. You are holding a buffer against the average case, which is already covered by your regular inventory cycle.
The formulas below are arranged from simplest to most accurate. More accurate formulas require more data. Start with the formula your data can support and move up from there.
Safety Stock = Average Daily Usage × Fixed Number of Days
You pick a fixed number of days based on judgment: 7 days, 14 days, 30 days. This is common in smaller operations where demand and lead times are fairly predictable.
Example: Average daily usage is 50 units. You decide to hold 10 days of safety stock.Safety Stock = 50 × 10 = 500 units
When to use it: When you do not have historical demand variability data, or when demand is consistent enough that a fixed buffer is sufficient.
Watch out for: This method does not adjust for any variability. If your demand swings significantly between peak and off-peak periods, a fixed number of days will leave you exposed in high-demand seasons and overstocked in slow periods.
Safety Stock = (Maximum Daily Usage − Average Daily Usage) × Maximum Lead Time
This formula accounts for the worst-case scenario by looking at the gap between your maximum observed demand and your average demand, applied across the longest lead time you have experienced.
Example:
Safety Stock = (80 − 50) × 14 = 420 units
When to use it: When you have historical data on demand peaks and lead time extremes but do not have standard deviation figures. This is the most practical formula for many manufacturing environments.
Watch out for: This method is conservative. It sizes your buffer for the worst case simultaneously occurring on both demand and lead time, which may not happen frequently. You may end up carrying more inventory than you need if peaks and lead time delays rarely coincide.
Safety Stock = Z × σ_d × √LT
Where:
This is the most widely used formula in supply chain management because it accounts for demand variability statistically rather than assuming worst-case.
Service level Z-scores:
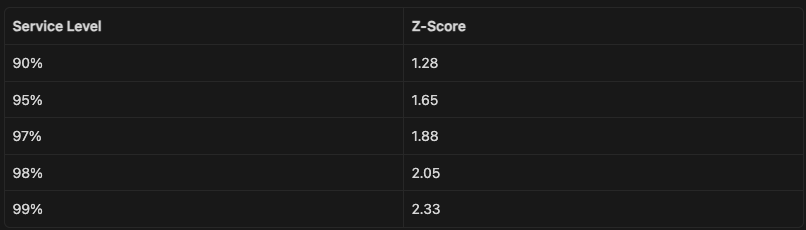
Example:
Safety Stock = 1.65 × 12 × √10 = 1.65 × 12 × 3.16 = 62.6 units (round up to 63)
When to use it: When you have enough order history to calculate a standard deviation of demand (typically 12 or more months of data). This is the right formula for most mid-market manufacturers running an ERP with transaction history.
Watch out for: This formula only accounts for demand variability, not lead time variability. If your supplier lead times fluctuate significantly, the next formula gives a more accurate result.
Safety Stock = Z × √(LT × σ_d² + d² × σ_LT²)
Where:
This is the most complete formula. It combines both demand variability and lead time variability into a single buffer calculation.
Example:
Safety Stock = 1.65 × √(10 × 12² + 50² × 3²)= 1.65 × √(10 × 144 + 2500 × 9)= 1.65 × √(1,440 + 22,500)= 1.65 × √23,940= 1.65 × 154.7= 255 units
When to use it: When your supplier lead times fluctuate noticeably, which is common in manufacturing environments with long-distance supply chains, single-source suppliers, or suppliers serving multiple industries with competing demand.

A practical starting point for most manufacturers: use Formula 2 to get a conservative number quickly, then refine with Formula 3 once you pull your ERP demand history. Move to Formula 4 if your supplier lead times vary by more than 20% from average.
A metal component distributor carries a high-velocity SKU used in HVAC assemblies. Here are their figures:
Formula 2 (Min-Max):
Safety Stock = (140 − 85) × 13 = 715 units
Formula 3 (Standard Deviation):
Safety Stock = 1.88 × 18 × √8 = 1.88 × 18 × 2.83 = 95.8 units
Formula 4 (Combined):
Safety Stock = 1.88 × √(8 × 18² + 85² × 2²)
= 1.88 × √(8 × 324 + 7,225 × 4)
= 1.88 × √(2,592 + 28,900)
= 1.88 × √31,492
= 1.88 × 177.5
= 333.7 units (334)
The gap between Formula 2 (715) and Formula 4 (334) is significant. Formula 2 is planning for the worst case on both demand and lead time occurring simultaneously, which is rarely the actual risk. Formula 4 is a statistically grounded number based on observed variability.
For this distributor, Formula 4 at a 97% service level means carrying 334 units of safety stock instead of 715. At their average unit cost of $12, that is $4,572 less tied up in inventory while maintaining nearly the same service level.
Using averages on both sides. If your formula uses average demand and average lead time without any variability data, you are calculating the inventory needed to cover the average case, not the safety stock needed to cover the exceptions.
Setting safety stock once and not reviewing it. Demand patterns shift. Supplier lead times change. A safety stock number calculated two years ago may be sized for a market that no longer exists. Review your safety stock at least annually, or whenever a major supplier or product line changes.
Applying the same formula to all SKUs. High-velocity, high-margin items warrant a more rigorous formula and a higher service level. Slow-moving items or items with long-but-predictable lead times can often be handled with a simpler buffer. Segment your SKUs by velocity and margin before calculating.
Ignoring minimum order quantities. If your supplier requires a minimum order of 500 units but your safety stock calculation says 120, your actual reorder dynamics are controlled by the MOQ, not your formula. Account for this when setting your reorder point.
Once you have a safety stock figure, it needs to live somewhere your purchasing and inventory teams can act on it.
In most ERPs, safety stock is set at the item/location level as a minimum quantity. When on-hand inventory drops to or below the reorder point (which includes safety stock as a component), the system generates a replenishment signal.
Make sure:
Use the Safety Stock Calculator to run your numbers for any SKU. Enter your lead time, demand variability figures, and target service level to get the recommended buffer.

.png)
